
Market Research · August 2026
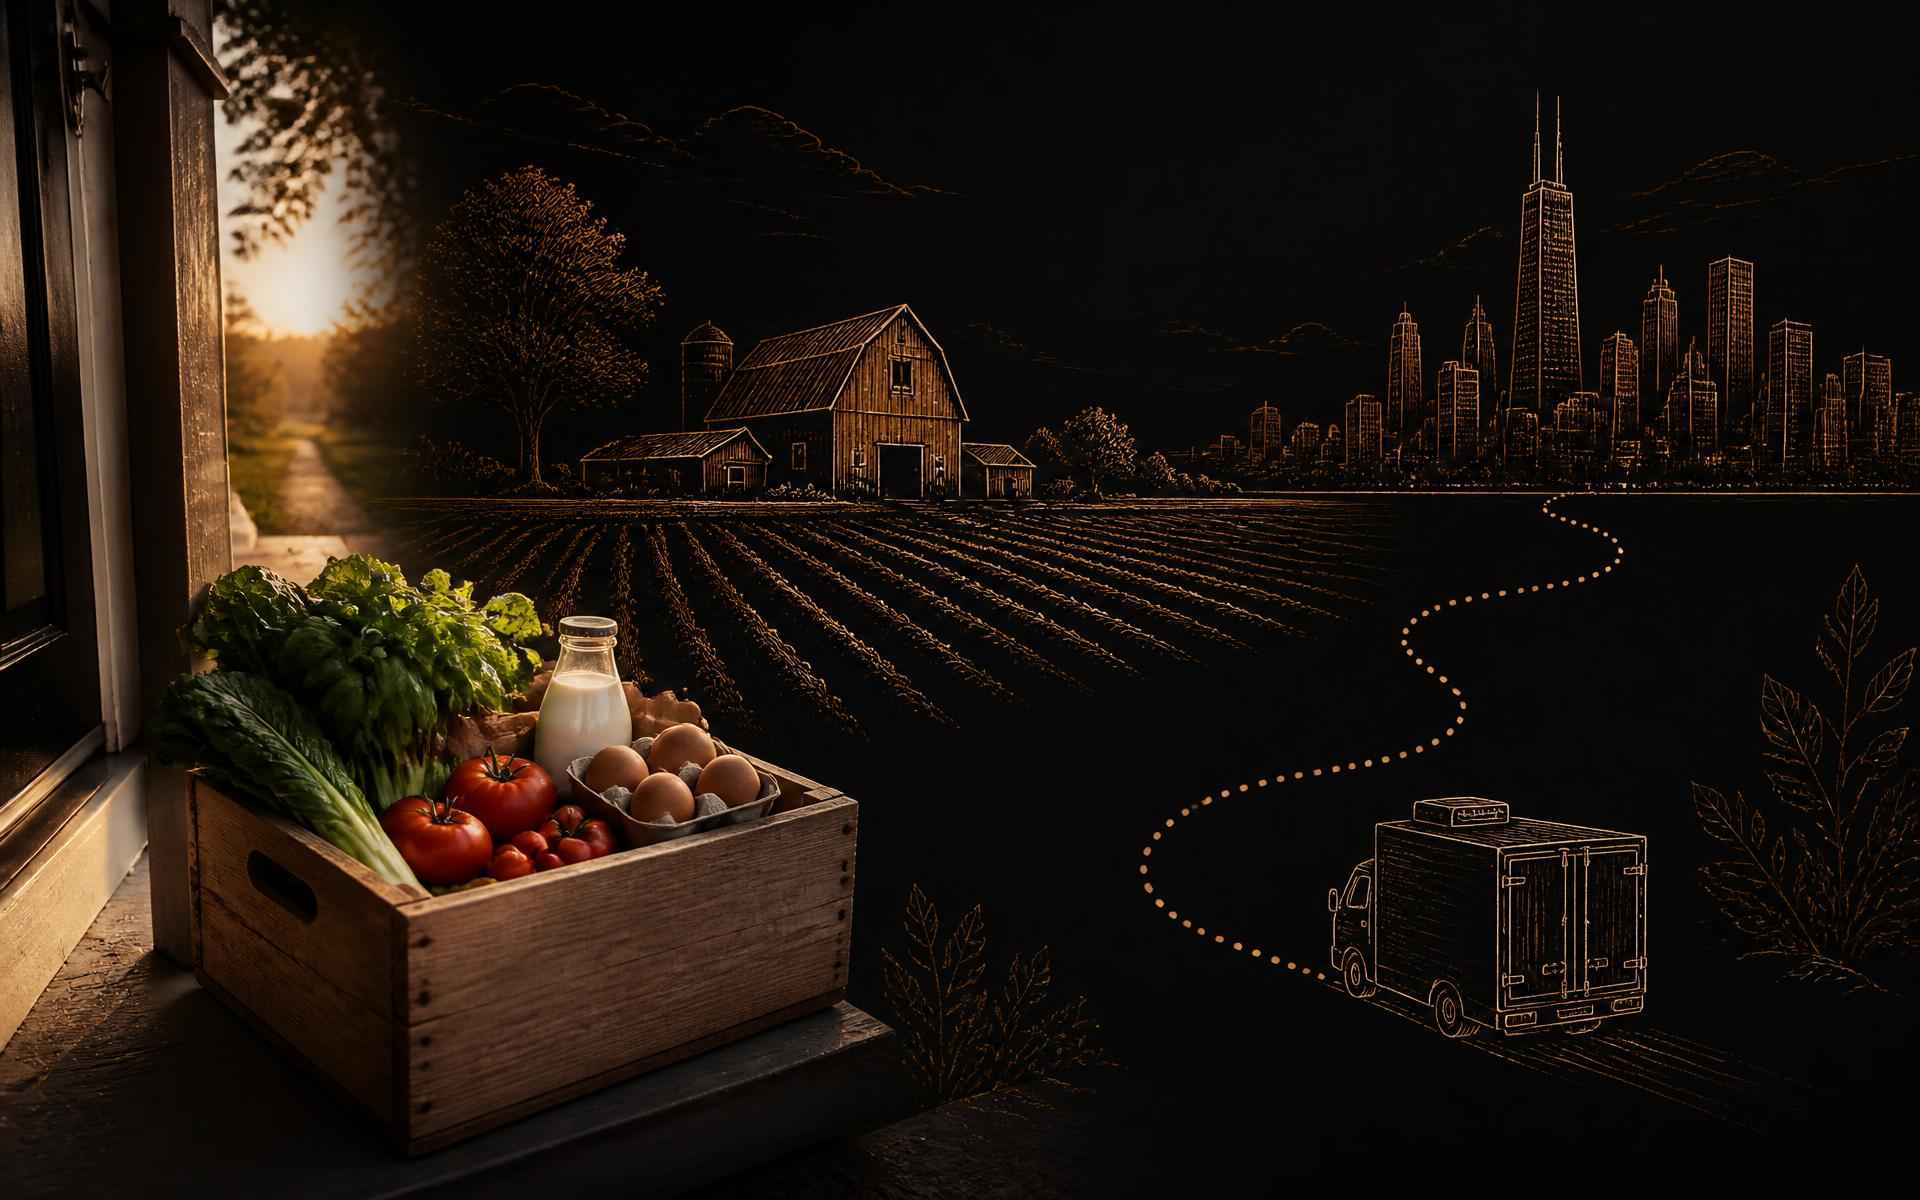
Fresh food, farm to door.
Market size, demand, unit economics, and business models, with a Chicago and Midwest operator landscape.
The market in nine numbers.
Demand is real and growing. The hard part is unit economics. Farm direct is a small, fast growing slice of a very large online grocery market, and the Midwest is structurally underweight relative to its production base.
US online grocery market in 2024, up 11.5% year over year. About $228B in 2025.
UniSight synthesis (vendor)
Fresh and perishables share of online grocery, the fastest shifting category.
UniSight (vendor)
US direct farm food sales, up 25% in real terms since 2017.
USDA 2022 Census (independent)
Of that, true direct to consumer farm sales: markets, CSA, on farm, online.
USDA NASS (independent)
US meal delivery market in 2025, heading to $44.1B by 2030 at 11.8% CAGR.
Grand View Research (vendor)
US households that have bought groceries online. 61% of them now buy fresh.
Industry syndicated, 2025 to 2026
Average online grocery order versus $42.83 in store, a 162% basket premium.
Industry syndicated, 2025 to 2026
Share of SNAP benefits redeemed online, a roughly $9B run rate from near zero.
USDA ERS (independent)
Revenue Peapod's Midwest arm still carried when it shut down. Execution, not demand.
Ahold Delhaize, 2020
Farm direct is a small slice of a very large pie.
That gap is the opportunity. The chart is to scale against online grocery.
Sources: USDA 2022 Census of Agriculture (direct farm and CSA, independent), UniSight synthesis (online grocery, vendor), Grand View Research (meal delivery, vendor). Mixed years, see the segment table.
Segment by segment, with the source labelled.
Note the definitional spread. IBISWorld's narrower NAICS cut puts online grocery at about $166B versus $204B to $228B for broader definitions. USDA figures are the gold standard.
| Segment | Latest size | Forecast | CAGR | Source and type |
|---|---|---|---|---|
| US online grocery (total) | $204B (2024) | $327B to $364B by 2030 | ~11 to 12% | UniSight / IBISWorld (vendor) |
| Fresh and perishables share | ~$84B (41%) | ~$102B (2025 est.) | ~12 to 14% | UniSight (vendor) |
| Total US direct farm food sales | $17.5B (2022) | ~$19B to $20B (2024 est.) | 4.6% per year real | USDA Census (independent) |
| Via retail, institutions, food hubs | $14.2B (2022) | Not published | +33.2% real | USDA ERS (independent) |
| Direct to consumer (DTC) | $3.3B (2022) | ~$3.5B | ~2 to 3% real | USDA NASS (independent) |
| CSA (farm channel only) | $225M (2020) | ~$230M to $260M | Flat, consolidating | USDA NASS LFMPS (independent) |
| US meal delivery and meal kits | $25.4B (2025) | $44.1B by 2030 | 11.8% | Grand View Research (vendor) |
| DTC meat box (ButcherBox alone) | ~$380M (2024) | Not published | Est. 50%+ YoY | PrivCo estimate (vendor) |
| Imperfect and surplus (Misfits + Thrive GMV) | ~$1.4B (FY25 proj.) | Not published | Flat to +5% | Pitchbook synthesis (vendor) |
| SNAP redeemed online | ~$9B run rate (FY23) | Large headroom (8.8% of SNAP) | Explosive | USDA ERS (independent) |
The USDA Census of Agriculture is collected every five years and 2022 is the latest. Vendor market sizing should be treated as directional.
Who is buying, and what stops them.
Adoption is broad and the basket is big. The failure mode is retention and delivery cost, not top of funnel interest.
Demand signals
- 61% of US households have bought groceries online, and 61% of those now buy fresh produce, meat, and dairy online.
- Online grocery grew about 10 to 12% year over year versus 1 to 2% in store. Monthly sales passed $11B for the first time in August 2025.
- Online average order value is $112 versus $42.83 in store, a 162% basket premium.
- Families with children are 168% more likely to buy groceries online monthly. The 25 to 44 cohort over indexes 1.8x.
- Median meal delivery subscriber income is $89,400 versus a $74,580 US median. 71% live in metros of 250k or more.
- Barn2Door reports 4 in 5 buyers want local food delivered, and farms offering delivery earn 2x or more monthly income.
- GLP-1 tailwind: 7M US users in 2024 heading to about 12M by the end of 2026. 22% of Trifecta's new subscribers are GLP-1 users.
Barriers
- Price and delivery fees. 41% of cancellations cite cost, and SNAP cannot pay delivery fees.
- Subscription fatigue. Average tenure is 7.4 months before the first cancel, and 27% cancel from food fatigue.
- Perishability and quality doubt. Cold chain adds 5 to 10 points to fulfillment cost.
- Curation models (meal kits, boxes) churn 12 to 18% per month versus 4 to 7% for replenishment models.
- The January problem. Midwest winters collapse local supply and demand for seasonal operations.
- Rural fulfillment gap. Online SNAP is nationwide, but delivery is overwhelmingly metro and rural skews pickup.
- CSA farms fell from 12,617 in 2012 to 7,244 in 2020, a mix of consolidation and channel shift.
What the P&L actually looks like.
The brutal math: a $45 refrigerated order at 45% margin nets about $1.35 in contribution after cold chain, so it takes roughly 37 repeat orders to repay a $50 CAC.
| Metric | Replenishment | Meal kit | Produce box | DTC meat box |
|---|---|---|---|---|
| Typical AOV | $45 to $75 | $55 to $75 | $55 to $70 | $149 to $179 per box |
| Gross margin | 40 to 50% | 30 to 40% | 30 to 40% | ~50% |
| Fulfillment and shipping (% revenue) | 10 to 20% | 20 to 30% | 25 to 35% | 20 to 30% |
| Contribution per order | $7 to $14 | ~$21 | $7 to $12 | Higher on big boxes |
| Blended CAC | $45 to $65 | $60 to $100+ | $42 to $60 | $60 to $100 (est.) |
| Monthly churn | 4 to 7% | 12 to 18% | 5 to 7% | 3 to 6% (est.) |
| Average tenure | 12 to 24 months | 6 to 18 months | ~19 months | 18 to 24 months (est.) |
| LTV to CAC | 5 to 10x | 2 to 4x (breaks at scale) | ~7.4x | 4 to 8x (est.) |
| Orders to repay CAC | 2 to 3 | 3 to 5 | 4 to 7 | 2 to 4 |
Sources: Eightx CFO guide 2026, Pitchbook and D2C Times 2026, PrivCo. Analytical estimates, no audited P&Ls except HelloFresh SE.
The Blue Apron autopsy, and the lessons.
Churn was structural, masked by growth
The 2014 cohort averaged an 18 month life. By the 2017 cohorts it was under 6 months. Economics were projected on early adopter behavior that never applied to the mass market.
CAC tripled when competition arrived
HelloFresh outspent Blue Apron 3 to 1 on Facebook in 2017 and CPMs doubled in six months. Paying $100+ to acquire a customer worth $250 only works if they stay. Most did not.
You cannot optimize retention and margin at once
Customers who would have stayed wanted flexibility and customization. Customization destroys the bulk purchasing economics that fixed menus depend on.
The outcome
IPO at about $2B in 2017, down 95% by 2019, sold to Wonder Group for $103M in 2023 after raising more than $1.3B.
Green BEAN Delivery
Indianapolis, 25+ markets, roughly $15M to $20M at peak. Closed November 2022 as post pandemic cost inflation plus Kroger, Walmart, and Instacart erased the organic delivery premium, against a capital heavy vertically integrated base of own farms, six warehouses, and 100+ trucks.
Peapod Midwest
Closed February 2020 while still doing $97M with 50,000 customers, because dedicated dark warehouses could not compete with rivals picking from existing stores, and Ahold had no Midwest retail banner to leverage.
Angelic Organics
Caledonia, Illinois. One of the largest CSAs in the country with about 2,000 member families and 40 Chicago pickup sites. Closed June 2024 after the founder's stroke with no successor. Owner operator CSAs carry irreplaceable key person risk.
The through line: recurring revenue is only valuable when retention is genuine rather than masked by acquisition, when CAC stays sane as competitors enter, and when LTV assumptions reflect current cohorts, not the enthusiasts who signed up first.
The eight models, and how each makes money.
| Model | How it earns | Economics and take rate |
|---|---|---|
| CSA subscription | Pre-paid seasonal share, direct from farm | $400 to $900 per season ($25 to $50 per week). Farm keeps 100% and bears all crop risk. Low CAC, high seasonal churn, same box fatigue. |
| Online farmers market | Aggregates many farms, platform handles logistics | Commission 15 to 30% of GMV (typically 20 to 25%) plus a $5 to $12 delivery fee. Route density is everything. 5 to 15% EBITDA at scale. |
| Food hub / aggregator (B2B) | Buys or brokers farm product, sells wholesale | 25 to 40% markup over farm gate. Volume driven, low marketing cost. Fastest growing USDA channel at +33% real. |
| DTC farm e-commerce | Farm sells direct online, ships frozen or regional | 40 to 60% gross margin versus 10 to 20% wholesale. AOV $100 to $200. Shipping at $15 to $25 per box is the swing factor. |
| Meal kit subscription | Weekly pre-portioned ingredients | $9 to $13 per serving. High churn (10 to 15% monthly) plus heavy CAC. A consolidation play. Scale requires an acquirer. |
| Smart vending / automated retail | Refrigerated units in high traffic venues | About $35k revenue per machine per year, 50 to 60% gross margin, $10k to $15k capex per unit. Venue takes 10 to 20% or hosts free. |
| Grocery delivery / third party platform | Marketplace layer over existing stores | 5 to 10% consumer service fee plus retailer commission plus ad revenue. Thin grocery margins make it ad subsidized. |
| Hybrid retail plus online | Store or cafe plus delivery plus wholesale | Spreads fixed warehouse cost across three revenue streams. Retail drives trust and discovery. |
Take rates are practitioner benchmarks and individual contracts vary. Aggregation and B2B currently out grow pure DTC.
The operator landscape, selected.
| Company | HQ | What they do | Model | Scale | Status |
|---|---|---|---|---|---|
| Market Wagon | Indianapolis, IN | Online farmers market, 400+ farms | Marketplace commission plus delivery fee | ~$11M revenue, $16.9M raised | Active |
| Farmer's Fridge | Chicago, IL | 2,000+ smart fresh food fridges | Vending and B2B venue plus DTC | ~$70M revenue, $131.5M raised | Active |
| Home Chef | Chicago, IL | Meal kits plus Kroger retail kits | Subscription plus retail hybrid | ~$270M revenue, Kroger acquired for $200M in 2018 | Active |
| Factor_ (Factor75) | Batavia, IL | Ready to eat prepared meals | Subscription DTC | ~$100M revenue, HelloFresh acquired for $277M in 2020 | Active |
| Irv & Shelly's Fresh Picks | Niles, IL | Local and organic grocery delivery, 100+ farms | DTC plus tiered delivery fee plus B2B | 250 ZIP codes, founded 2006 | Active |
| Local Foods | Chicago, IL | Wholesale to 250+ restaurants and institutions plus retail | B2B wholesale plus retail store | $2.5M raised | Active |
| Meez Meals | Evanston, IL | Prepped, pre-chopped DIY meal kits | A la carte DTC, no subscription | ~$5.7M revenue | Active |
| Seven Sons Farms | Roanoke, IN | Grass fed beef, pastured pork and chicken | DTC farm e-commerce plus bundles | ~$5.6M revenue | Active |
| US Wellness Meats | Canton, MO | 100% grass fed meat, nationwide shipping | DTC e-commerce | Founded 2000 | Active |
| Grass Roots Farmers' Co-op | Clinton, AR (Midwest farms) | Multi farm co-op, pasture raised, blockchain traceability | Cooperative DTC | Founded 2014 | Active |
| Harvie | Pittsburgh, PA (Midwest expansion) | CSA aggregator plus farm SaaS | Marketplace plus SaaS hybrid | $236.5k raised | Active |
| The Common Market Great Lakes | Chicago, IL | Nonprofit wholesale hub to institutions | Nonprofit B2B distribution | 300+ farms nationally | Expanding |
| FamilyFarmed / Good Food Catalyst | Chicago, IL | Nonprofit accelerator, financing, festival | Grant funded ecosystem support | 13,700+ farmers trained | Active |
| Angelic Organics | Caledonia, IL | Biodynamic CSA, 40 Chicago pickup sites | Classic CSA subscription | ~2,000 members | Closed June 2024 |
| Green BEAN Delivery | Indianapolis, IN | Organic grocery delivery, own farms and fleet | Membership subscription, vertically integrated | ~$15M to $20M peak | Closed November 2022 |
| Peapod (Midwest) | Chicago, IL | First US online grocery delivery | Dark store delivery | $97M Midwest revenue | Closed February 2020 |
Private company revenue figures are third party estimates (LinkedIn, Crunchbase, PrivCo aggregations), not audited. Status verified to 2026 where possible.
Why this region is structurally underweight.
The Midwest produces the food but captures little of the direct sales value. Short farm to city distances plus dense metros make last mile economics more favorable here than in sprawling Sun Belt markets, if the winter gap is solved.
Of all US direct farm sales come from California. The Midwest badly under indexes.
People across the eight state Midwest. Chicago metro alone is about 9.5M, third largest in the country.
Farmland within a two hour drive of Chicago, a density no other major metro has.
Real growth in farm sales through hubs and institutions. B2B is out growing DTC 3 to 1.
The January problem
November through April collapses local supply. Year round demand is required to hold routes.
Dense B2B
Northwestern, Rush, UChicago Medicine, universities, and corporate campuses sit inside the same delivery radius.
Where the white space is.
SNAP and EBT integration
The biggest untapped lever. About $100B in annual benefits, and online is only about 8.8% of redemptions (a roughly $9B run rate, up from near zero in 2020) across 341 authorized retailers and about 3.9M households. Rural users are badly underserved. The structural catch: SNAP cannot pay delivery fees, so the fee model has to be engineered around it.
B2B and institutional is out growing DTC
USDA shows sales through retail, institutions, and food hubs grew 33.2% in real terms versus 2017, roughly 3x the DTC rate, and 60,332 farms now sell through these channels. Hospitals, schools, universities, and corporate dining need traceability, food safety paperwork, and credit terms that individual farms cannot provide alone. The hub supplies exactly that.
Aggregation beats single farm
Multi farm aggregation spreads logistics cost, fills the assortment gap (the number one churn driver in CSA), and smooths seasonality. Platform enablers include Barn2Door (about $99 per month flat SaaS plus delivery as a service within 90 miles of metros, where farms with delivery earn 2x or more), Loca Line for B2B, and GrazeCart for weight based sellers.
Flexibility beats rigid subscription
Skip, pause, and customize while protecting AOV. Thrive Market's $59.99 per year membership yields a 26 month tenure and 3.9% monthly churn, best in class, because an annual commitment filters for intent. Rolling and seasonal tiers set honest expectations against agricultural reality.
Raise AOV, the fastest margin lever
Moving a refrigerated order from $45 to $75 through bundles swings contribution from about $1.35 to about $14.25. Higher AOV, multi node fulfillment, and route density are the difference between a business and a hobby.
GLP-1 and medical nutrition tailwind
7M US users in 2024, about 12M by the end of 2026, about 17M by 2028. High protein, whole food, portion flexible farm direct offerings map naturally. Factor added GLP-1 menu tagging after 30%+ year over year growth.
Hybrid retail, delivery, and wholesale
The Local Foods model of store, cafe, butcher, and 250+ institutional accounts spreads warehouse fixed costs across three revenue lines and builds discovery. Pickup is projected to pass 50% of online grocery by 2027 and is far cheaper than delivery.
Imperfect and surplus produce
Durable when disciplined. Imperfect Foods runs about 7.4x LTV to CAC on a 19 month tenure after exiting weak markets to focus on 22 core metros. Geographic concentration, not expansion, is what fixed the margin.
Sources.
Independent government sources (USDA) are the highest confidence figures in this report. Vendor market sizing and private company revenue estimates are directional and labelled as such throughout.
- USDA NASS, 2022 Census of Agriculture (direct farm sales, farm counts), February 2024.
- USDA ERS, 'Agricultural Census shows strong growth in direct sales from farms and ranches', March 2024.
- USDA NASS, Local Food Marketing Practices Survey (CSA farms and revenue), 2022.
- USDA ERS, 'Almost 9 percent of SNAP and P-EBT benefits were redeemed online by end of FY2023', October 2024.
- USDA FNS, SNAP online purchasing nationwide expansion and authorized retailer counts, 2023 to 2026.
- USDA FNS and Abt Associates, Evaluation of SNAP Online Purchasing (rural versus urban fulfillment), September 2023.
- UniSight BIT, 'What Percentage of Grocery Sales are Online in 2025?', 2025 (vendor synthesis).
- IBISWorld, Online Grocery Sales in the US, December 2025 (narrower NAICS definition).
- Grand View Research, Meal Delivery Statistics 2026: market size and pricing, 2026.
- Eightx, 'Food Brand Unit Economics: A CFO's Guide', June 2026 (analytical benchmarks).
- D2C Times and Pitchbook, 'Imperfect Foods vs. Misfits Market: LTV comparison', July 2026.
- The Business Owner's Edge, 'They Had 1 Million Subscribers. Then the Model Broke.' (Blue Apron), May 2026.
- PrivCo, ButcherBox company profile (private company estimate), 2026.
- Indianapolis Business Journal, 'Green Bean Delivery calling it quits', November 2022, plus 2015 profile.
- Ahold Delhaize USA, 'To Close Midwest Online Grocery Sales Operations' (Peapod), February 2020.
- Chicago Tribune, 'Peapod shutting down grocery delivery in the Midwest, cutting 500 jobs', February 2020.
- Block Club Chicago, 'Angelic Organics Farm, Popular CSA Serving Chicago, Suddenly Closes', June 2024.
- Barn2Door, 'Barn2Door vs. GrazeCart: 2026 Comparison for Independent Farmers', April 2026 (vendor).
- The Intelligencer, 'Edwardsville farm delivery service brings local foods to doorsteps', June 2026.
- Company sources: Market Wagon, Farmer's Fridge, Home Chef, Factor_, Local Foods, Irv & Shelly's Fresh Picks, Seven Sons, US Wellness Meats, Grass Roots Co-op, Harvie, The Common Market, FamilyFarmed (2025 to 2026).
Keep going
Take the next brief with you.
The CTV benchmarks brands quietly pay for
Household targeting, creative reuse, and the CPMs that actually move retail sell-through.
Spotlight Shelf, Chicago retail seats for Q1 2027
Lit displays, sampling associates, and velocity data inside top Chicago grocery.
What it costs to win at the shelf
Retail media and merchandising benchmarks brands actually pay, from shipper to smart shelf.
The demand is proven. The economics decide the winner.
Higher AOV, flexible subscriptions, multi farm aggregation, B2B and institutional channels layered on DTC, SNAP integration, and frictionless ordering. That is the playbook the survivors share.
© 2026 Golden Scope Partners · Benchmarks compiled August 2026 · Ranges, not quotes